Some figures for age-stratified mortality/case data in Florida and Australia
August 15, 2020
Though not widely discussed, there is some precedent for expecting seasonal effects on severity in respiratory infections; see Dowell 2001 for discussion. Little attention has been paid to whether seasonality could have a significant effect on mortality for COVID-19. Here we present a very simple and preliminary comparison of age-stratified mortality data from first and second waves in Florida and Australia, in the hope to draw more attention to the importance of this question.
All data we use is from the CoverAGE-DB project. In particular we use the raw InputDB.csv data file. Code to generate these figures is here.
Description of the figures
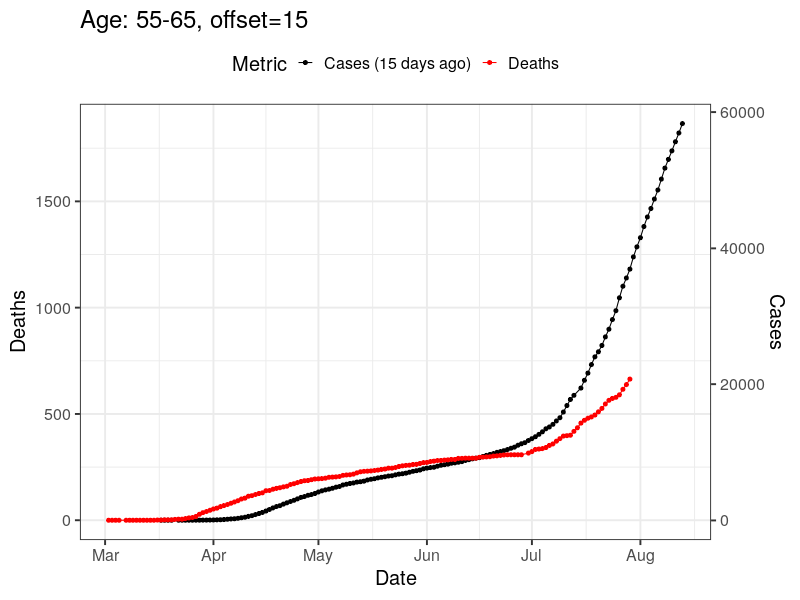
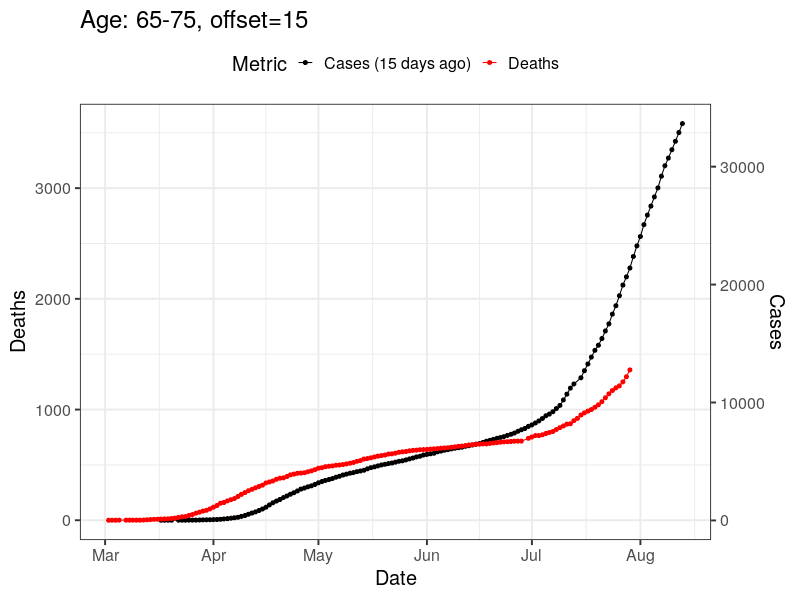
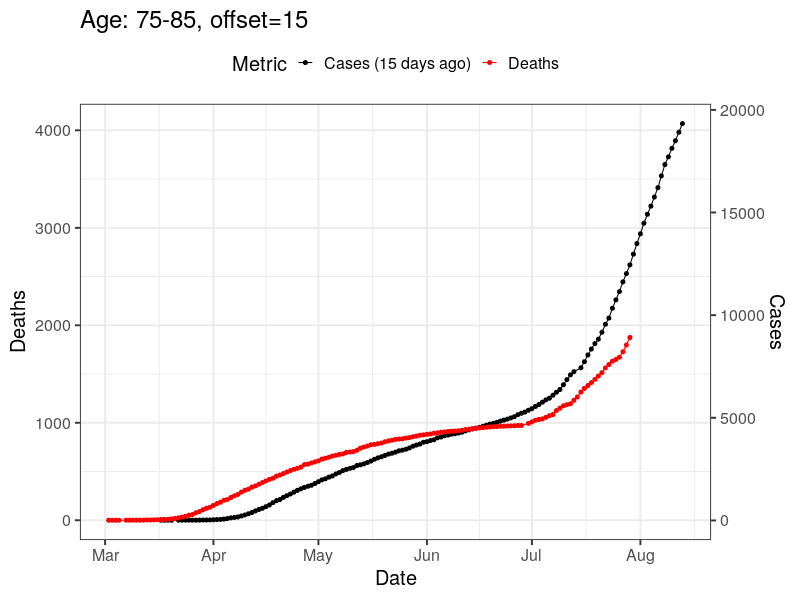
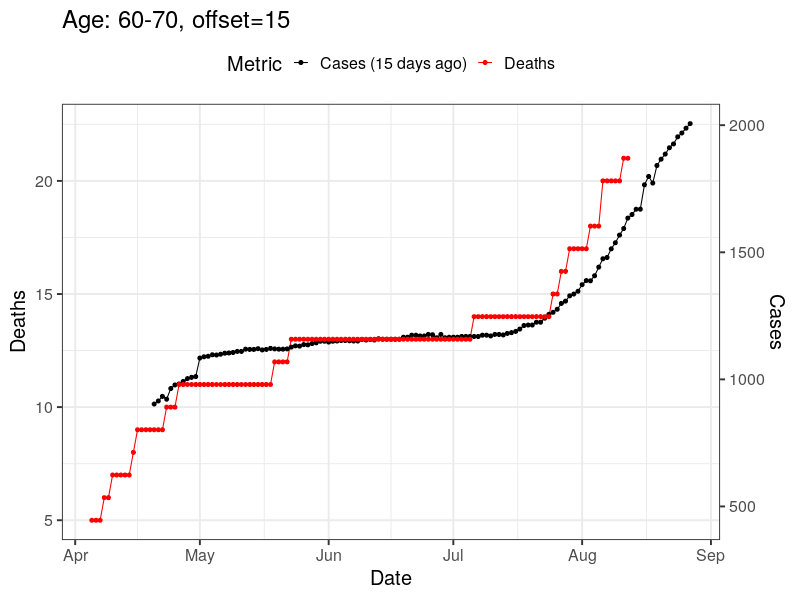
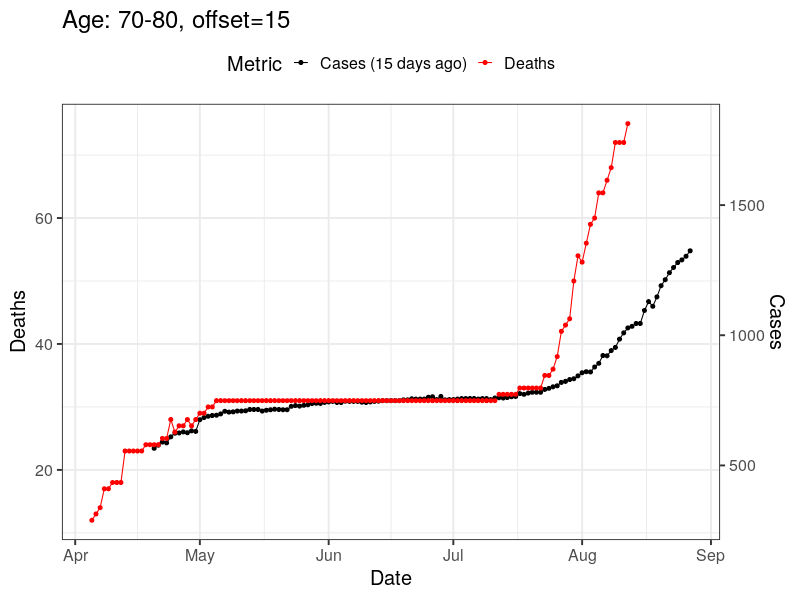
For each age group in the given region, we plot cumulative cases (offset by 15 days) and cumulative deaths on a single chart, using different scales. We choose the relative scales so that the case and death curves coincide at June 15. Note that this means that if, post-June 15, all deaths occured roughly 15 days after being identified as a case, and CFR agreed well with CFR up to June 15, then the rescaled case and death curves would nearly coincide after June 15.
In particular, having similar CFR between the first and second waves would correspond to having similar derivatives (possibly time-shifted, depending on the extent to which 15 days is a good choice of offset) between the rescaled case and death curves. When the derivative of the death curve appears to be a >1 multiple of the derivative of the rescaled case curve after June 15 this suggests a greater CFR in the second wave. When the derivative of the death curve appears to be a <1 multiple of the derivative of the rescaled case curve after June 15 this suggests a lower CFR in the second wave.
Figures from Florida
Figures from Australia
Caution
These figures are intended to illustrate that the question of seasonal effects on severity and mortality for COVID-19 merit serious attention. Note that while the pattern of low CFR in Florida seems mirrored in many Northern Hemisphere countries, Australia appears to be a unique example of a country which has collected good data on two independent waves of COVID-19 in the Southern Hemisphere. More fundamentally, there are many counfounding factors which could undermine a comparison like this. However the possibility of a seasonal effect on CFR seems to merit more concerted investigation than it has received.